Live Tides
NOTICES TO MARINERS
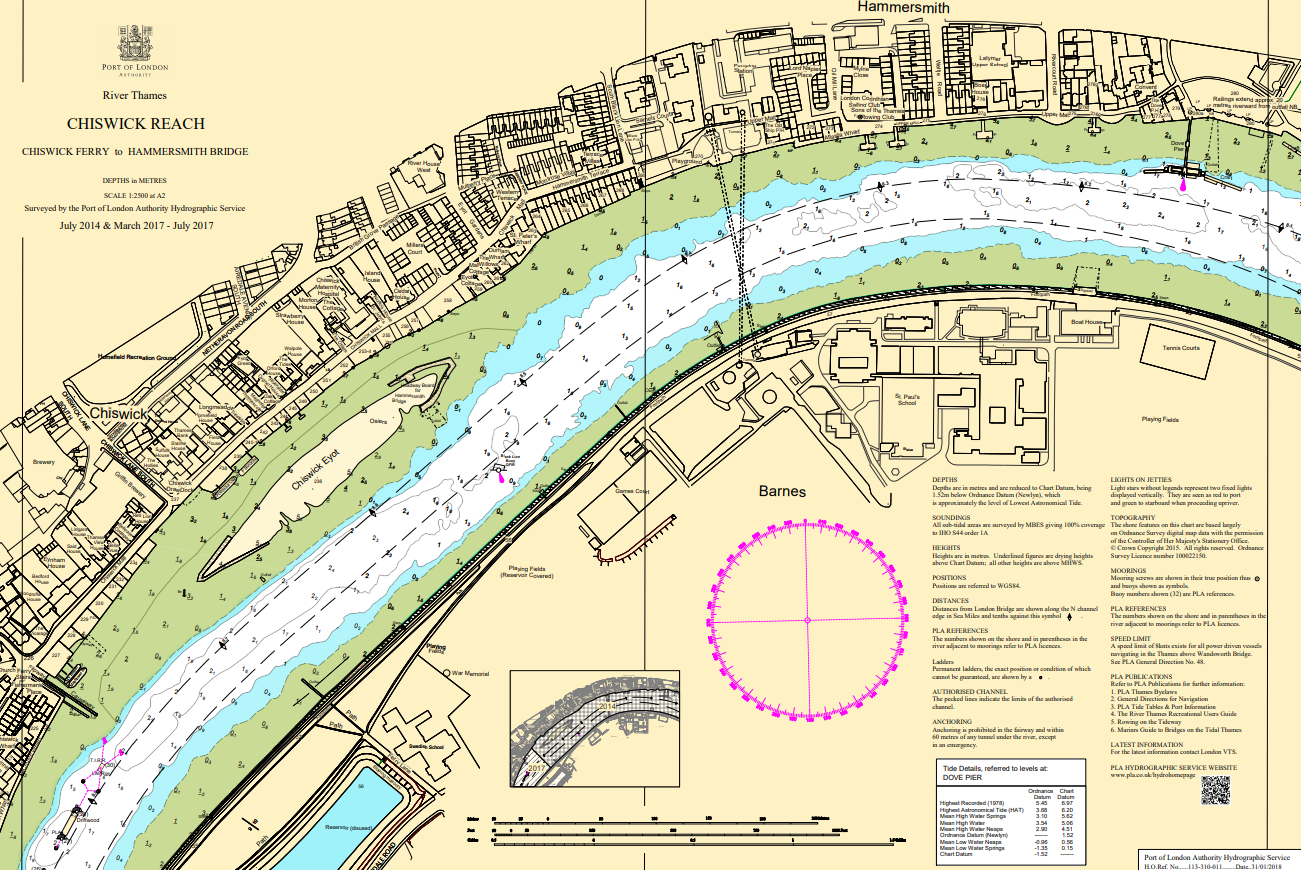
Charts & Surveys
Incident reporting
Life-threatening emergencies on the river:
Call 999 and ask for the Coastguard
For near miss, safety observations and incident reporting click below
Our commitments
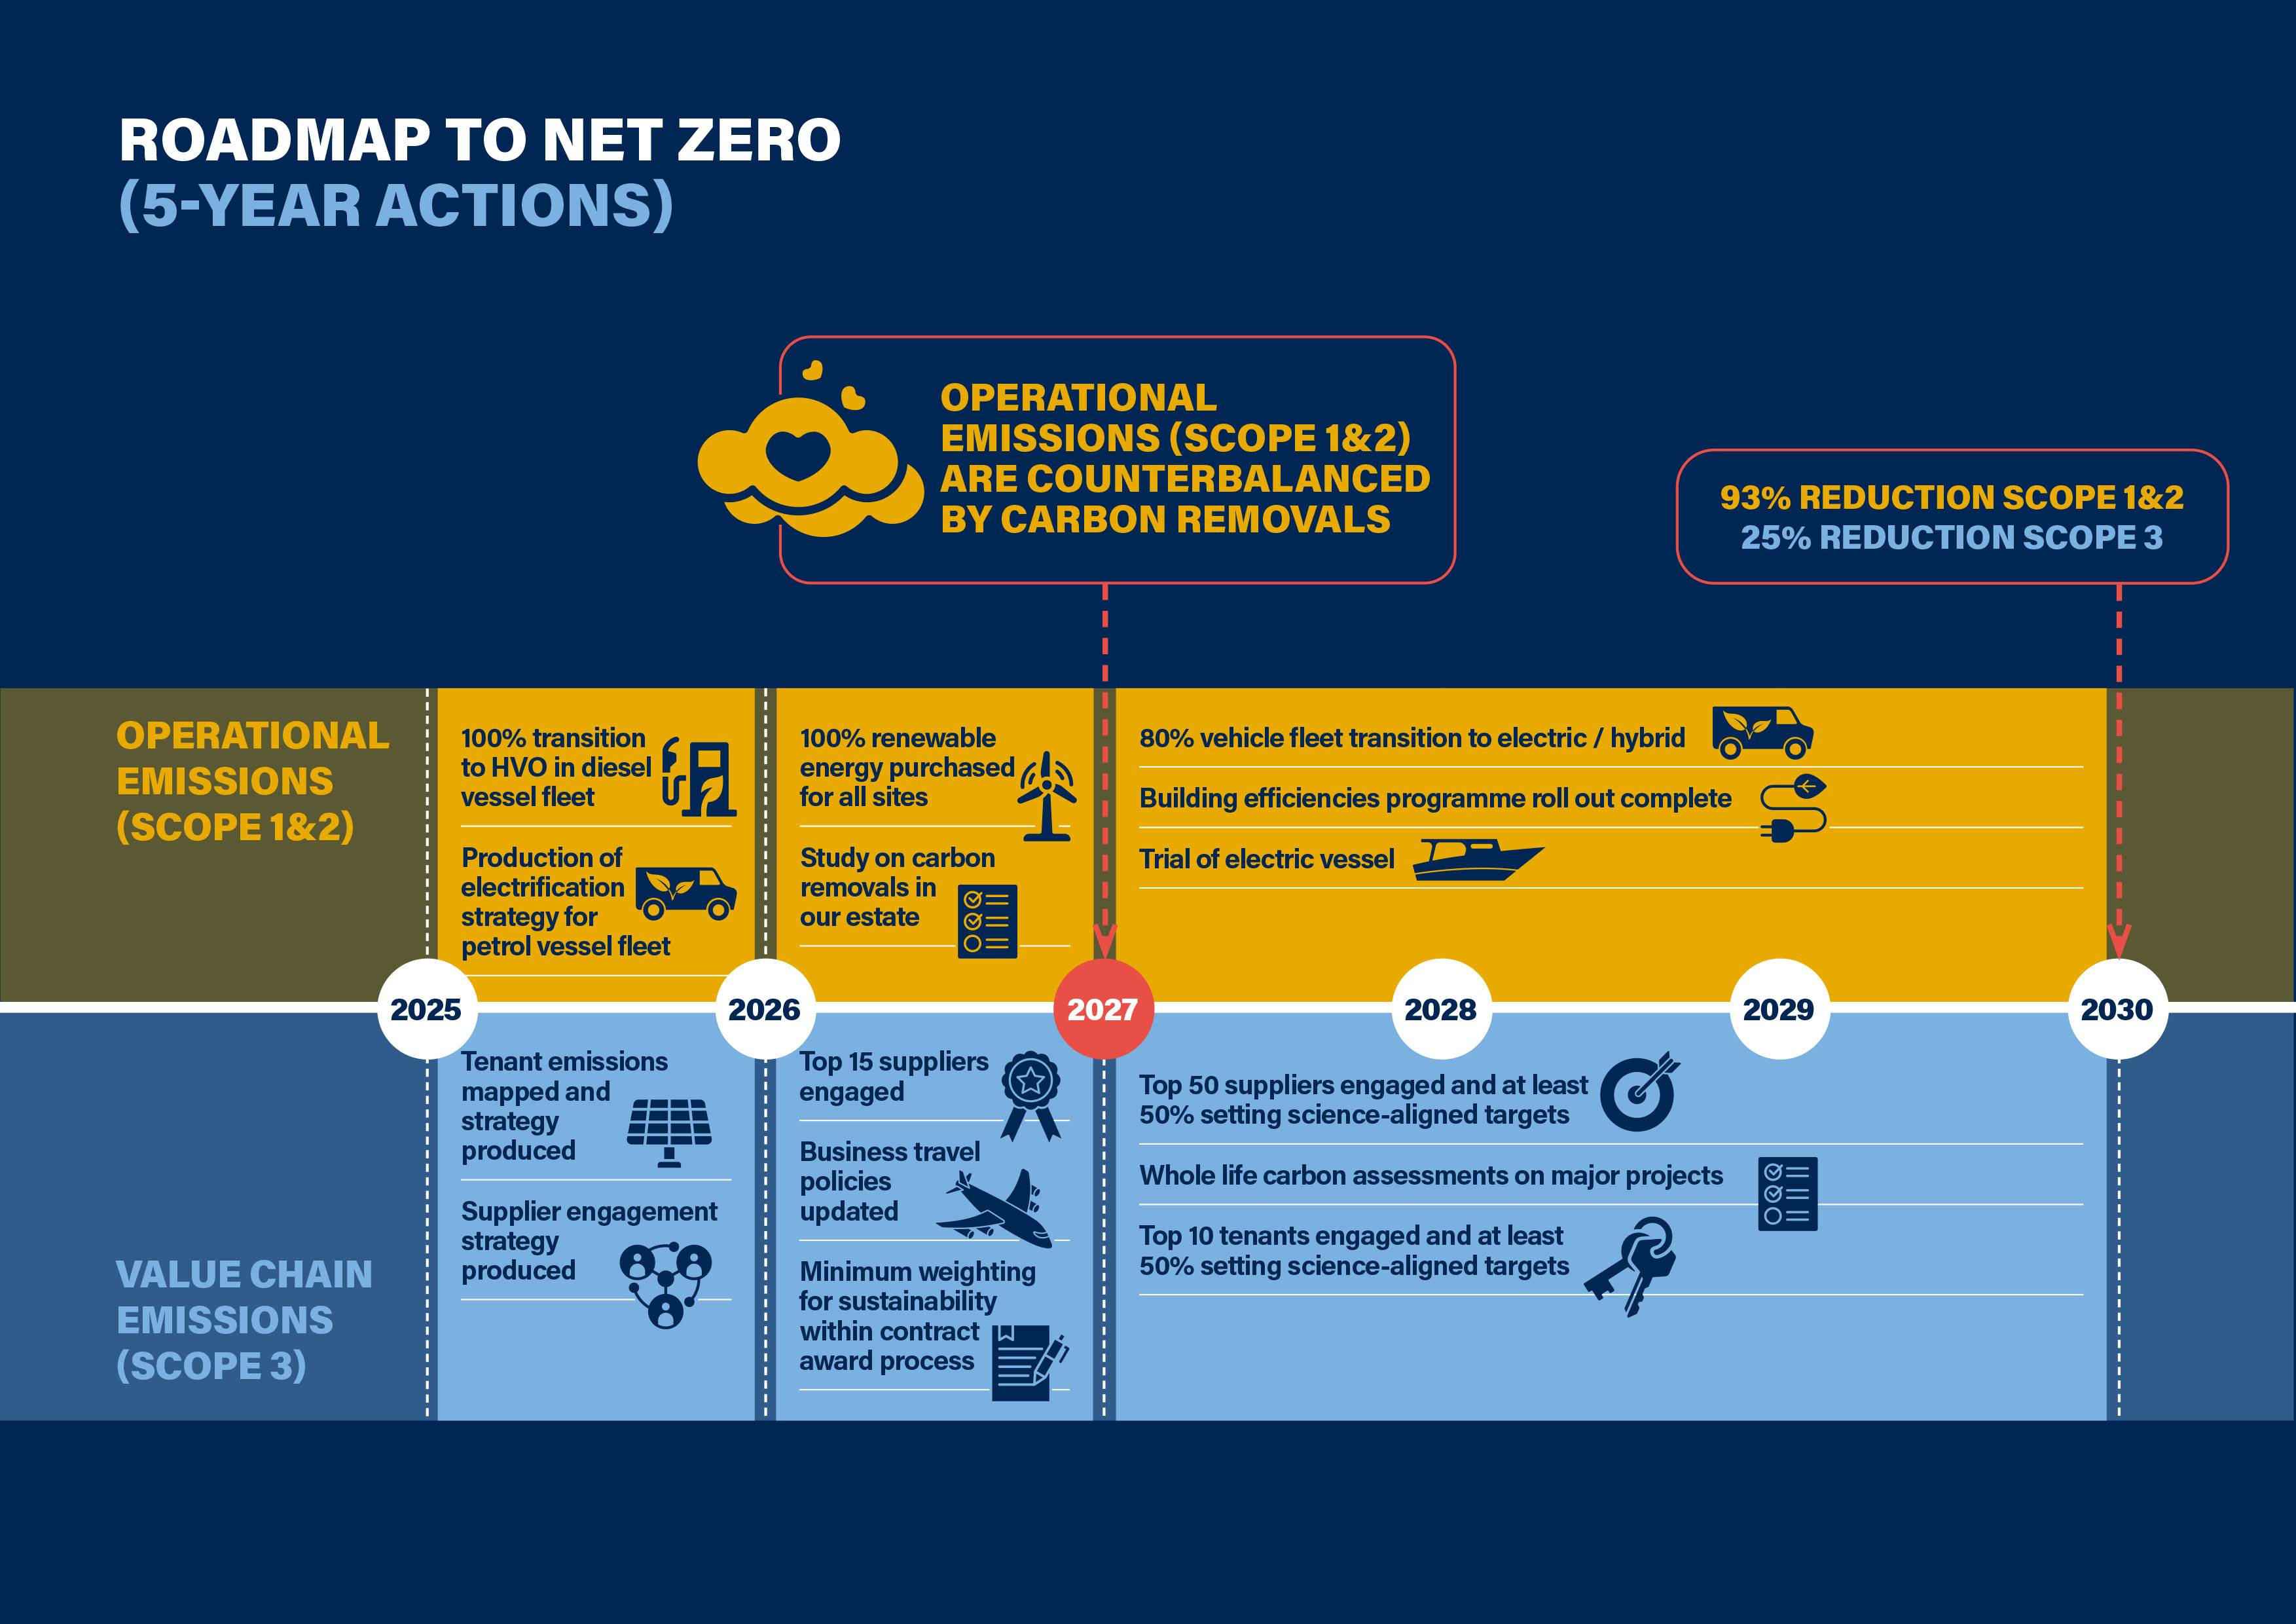
-Operational emissions (scope 1&2) are counterbalanced by carbon removals in our estate by 2027
-Net Zero in our full value chain (Scope 1,2&3) by 2040
Executive summary
Our approach
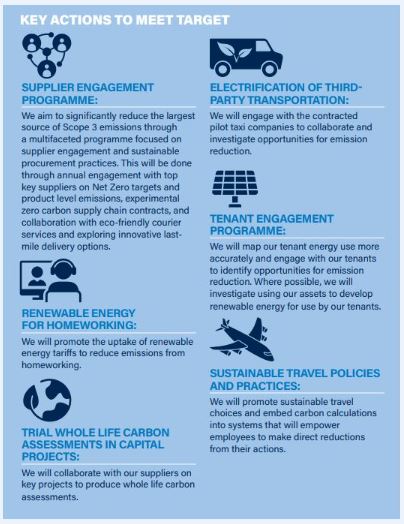
Our key actions
- Reduce emissions first, and use offsetting as a last resort, in line with the Science Based Targets Initiative principles.
- Set targets in line with the approach of the SBTI, and that are 1.5 degrees Paris-aligned – and support with concrete actions.
- Maximise the value of our physical assets for sustainability, including consideration of how we support the wider transition of the Thames and the UK
- Continue to reduce our fuel associated emissions through transitioning to alternative fuels and green technology.
- Reduce emissions in our supply chain through working closely with suppliers on reducing their own emissions.
- Improve our data quality and accuracy to ensure we are targeting the most impactful actions and meeting our overall objectives.
Introduction
As custodian of the tidal Thames, The Port of London Authority (PLA) remains committed to a healthy future for the river and its port activities.
To support this aim, we are committed to achieving net zero emissions in our operations, and across our value chain by 2040.
The PLA has been on an ambitious decarbonisation journey for the last ten years. This plan aims to build on these previous successes, as well as set a new trajectory to meet our goals. We first calculated the carbon footprint of our emissions in 2014, when carbon reporting was in its infancy.
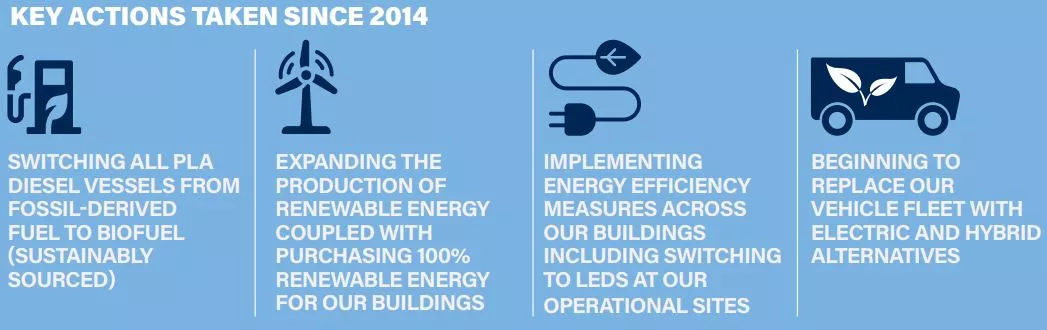
This allowed us to set out on an ambitious journey to significantly reduce our carbon emissions, focusing on Scope 1&2. We did this in a variety of ways. We invested in producing solar energy on our operation sites. From January to June 2024, we generated 114MWh through solar photovoltaics – enough to power approximately 10% of our buildings’ electricity requirements.
We also took concrete steps to reduce emissions in our Scope 1 – focusing on transitioning our vessel fleet from diesel to sustainably sourced HVO (Hydrotreated Vegetable Oil). By 2023 these actions resulted in an 83% decrease in the PLA’s Scope 1&2 emissions from 2014. After ten years of successful carbon reductions, it was time to take stock of our progress and chart a new journey to reach our goals.
We only have 15 years left to reach net zero, we know we need to renew and refocus our efforts. Over the next five years, we will continue to reduce our fuel associated emissions, maximise our landholdings’ carbon removal potential, and get even better at managing our data. We will also engage with our suppliers and tenants to ensure that they are working with us to reduce Scope 3 emissions.
We believe that it’s crucial that we do this, as ports underpin the global economy and play an essential role in our everyday lives. More than 80% of global merchandise trade is transported via sea. The Port of London Authority is in a unique position, given our previous successes, to lead the way on decarbonisation for our sector.
How we define 'Net Zero'
Net-zero emissions are achieved when anthropogenic emissions of greenhouse gases to the atmosphere are balanced by anthropogenic removals over a specified period. Where multiple greenhouse gas emissions are involved, the quantification of net zero emissions depends on the climate metric chosen to compare emissions of different gases (such as global warming potential, global temperature change potential, and others, as well as the chosen time horizon).
HOW WE DEFINE ‘SCOPES 1,2,3’
Scope 1 covers all direct emissions, mainly from burning fuel but also other industrial processes.
Scope 2 covers indirect emissions from the use of purchased electricity. This is reported in two ways:
- Location-based refers to the actual emissions of electricity production on the grid.
- Market-based accounts for any contractual entitlements to report lower emissions, such renewable energy certificates.
Scope 3 contains all other indirect emissions, split into several categories across the value chain
Our story so far
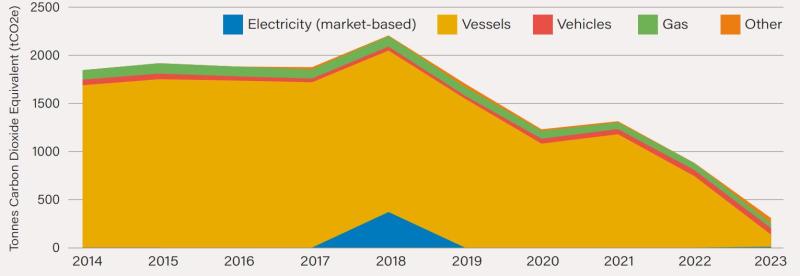
In 2014, the PLA implemented its first emissions reduction plan, focusing on the most material Scope 1&2 emissions for our operations. This has resulted in an 83% decrease in the PLA’s Scope 1&2 emissions in these key emission categories as shown in the graph below. These reductions have been driven by the transition of our vessel fleet to sustainable HVO, implementing energy efficiency measures, purchasing renewable electricity and investing in renewable energy production on our sites.
However, we also know that this picture of our emissions was incomplete, based on the best available information at the time of developing our plan. In 2023, we went through a full audit of our carbon footprint to bring it up to date and ensure we are capturing all our emissions going forward.
PLA Scope 1+2 Greenhouse Gas Emissions (Market-Based)
Measuring Emissions
Our carbon footprint is reported in tonnes of carbon dioxide equivalent (tCO2e). This is the amount of equivalent carbon emissions generated by the main greenhouse gases (carbon dioxide, methane, nitrous oxide etc.) each of which has a ‘Global Warming Potential’ factor that is included in the overall conversion factor. Emissions are calculated by multiplying conversion factors by activity data, such as fuel or energy consumption, resource use or mileage.
Emissions (tCO2e)= activity data × emission factor
The PLA uses the calendar year (1st January to 31st December) as the reporting period for our GHG inventory.
How we source our HVO
We are committed to purchasing sustainable HVO from reputable suppliers. All HVO supplied to PLA is ISCC verified waste derived product, free from palm oil. The Proof of Sustainability confirms the origin of raw materials, certifying that none of their products contribute to global deforestation
Our approach
2023-onwards
In 2023, we went through a full review of our methodology to bring us in line with Science Based Target initiative (SBTi) best practice guidance. This was prompted by a number of key changes to our operations including the purchase of a company by the PLA Group, the need to include full Scope 3 emissions, and an aging baseline for our carbon reporting. The key findings from this review were used to strengthen our reporting and create the actions within this action plan.
They included the key changes highlighted below:
- Updated our baseline year from 2014 to 2023 in line with best practice.
- Updated our Scope 1&2 emissions to include F-gases and all remote site energy use. • Updated our Scope 3 emissions to include purchased goods and services, capital projects, employee commuting, business travel via public transport and leased assets. Emissions from our industrial tenanted properties will be included in our 2026 update.
- Included both a market-based and location-based calculation for our Scope 2 emissions which captures our choices to purchase renewable energy, as well as the energy mix of our local supply.
- Included our fully owned subsidiary, Estuary Services Limited, as part of our Group level emissions data. ESL was purchased in 2021 and we began reporting on emissions from 2022.
This has resulted in a material change to our carbon emissions. Our new baseline which includes all emission Scopes across our full group is 9687 tCO2e – an 800% increase compared to what we reported in 2022 (primarily driven by Scope 3 emissions). This increase represents a truer calculation of our total emissions impact through our full value chain.
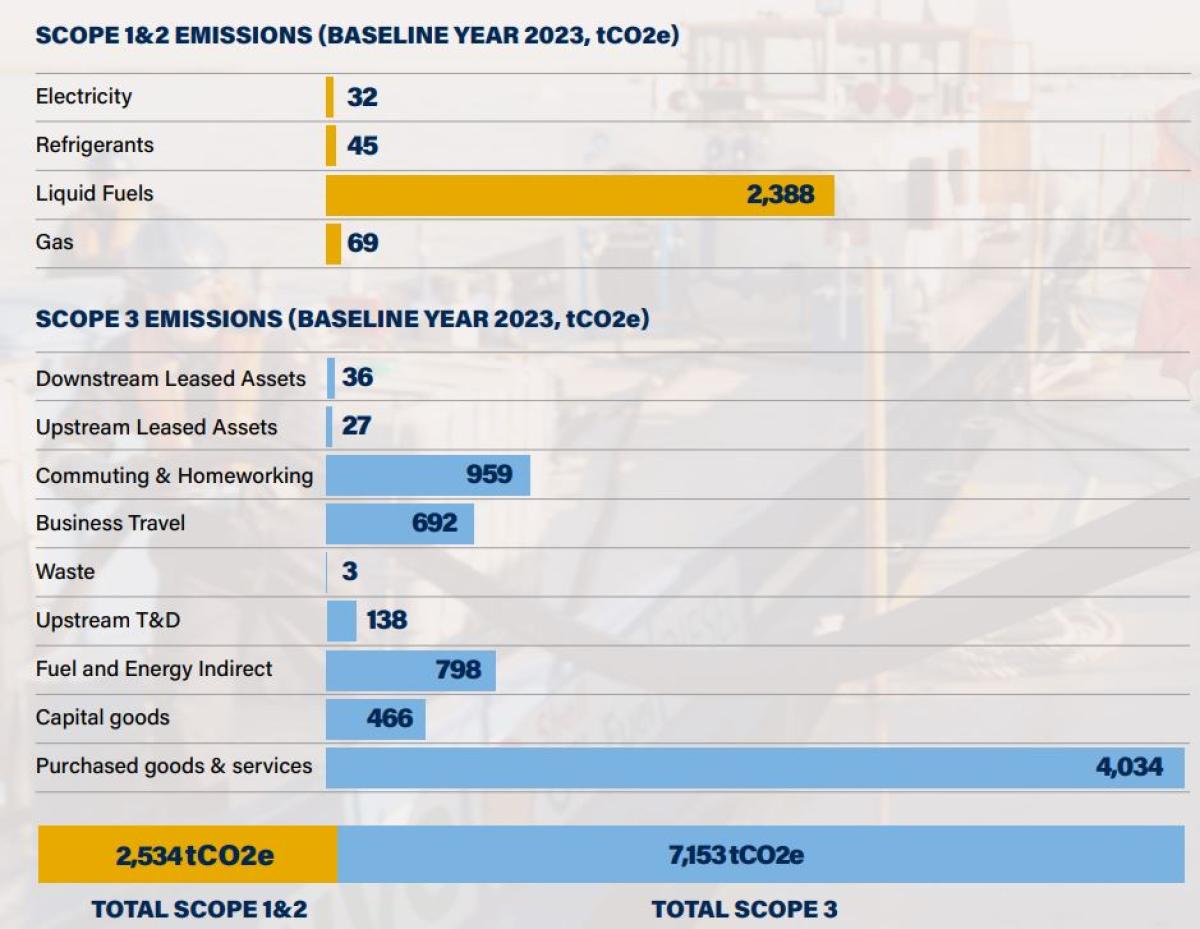
Scope 1 & 2 Emissions Definitions
- Gas – this covers the gas from the grid used for space and water heating.
- Liquid Fuels – this covers the fuel used in vessels, vehicles, plant, and generators that we own and operate.
- Refrigerants – this covers the fugitive emissions of refrigerant gases from installation and operation of our air conditioning systems
Scope 3 Emissions Definitions
- Purchased Goods and Services – this covers the production of goods and services we purchase that are not accounted for in other specific categories.
- Capital Goods – this covers the production of capital goods we purchase in a year.
- Fuel and Energy Indirect – this covers the production of fuels and energy we purchase (known as Well-to-Tank), as well as inefficiencies in energy distribution via the National Grid.
- Upstream and Downstream Transportation and Distribution – this covers transportation of products we purchase between our Tier 1 suppliers to our own sites by third parties. • Waste – this covers the transportation, disposal, and treatment of the waste we generate from our operations by our licensed waste contractors.
- Business Travel – this covers transportation of staff for business related activities in vehicles not owned or operated by the PLA.
- Employee Commuting and Homeworking – this covers transportation of staff between their homes and their worksites in vehicles not owned or operated by the PLA. It also optionally includes the energy use of working from home.
- Upstream Leased Assets – this covers the operation of assets leased to the PLA, which are not included in scope 1 and scope 2.
- Downstream Leased Assets - this covers the operation of assets leased out by the PLA, which are not included in scope 1 and scope 2
Our new baseline
We have updated our baseline and have readjusted our targets to be more ambitious. This recognises the substantial progress we have already made but also the urgency we feel to act as quickly as possible. The most material of change in our baseline Scope 1&2 is vessel emissions from our subsidiary company, and in Scope 3 is emissions from purchased goods and services.
Our targets
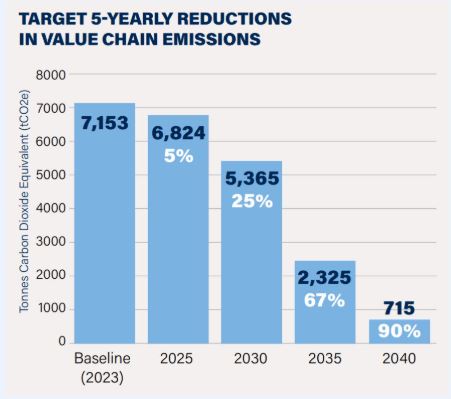
Along with updating our approach, we have updated our targets in line with SBTi guidance. Despite measuring more of our emissions, we are still on target to reach net zero by 2040. We have identified two milestone commitments, mapped our science-based trajectory, and set our interim targets to keep us on track.
Our interim trajectory and interim targets are designed to push as fast as we can on Scope 1&2 emissions as early as possible.
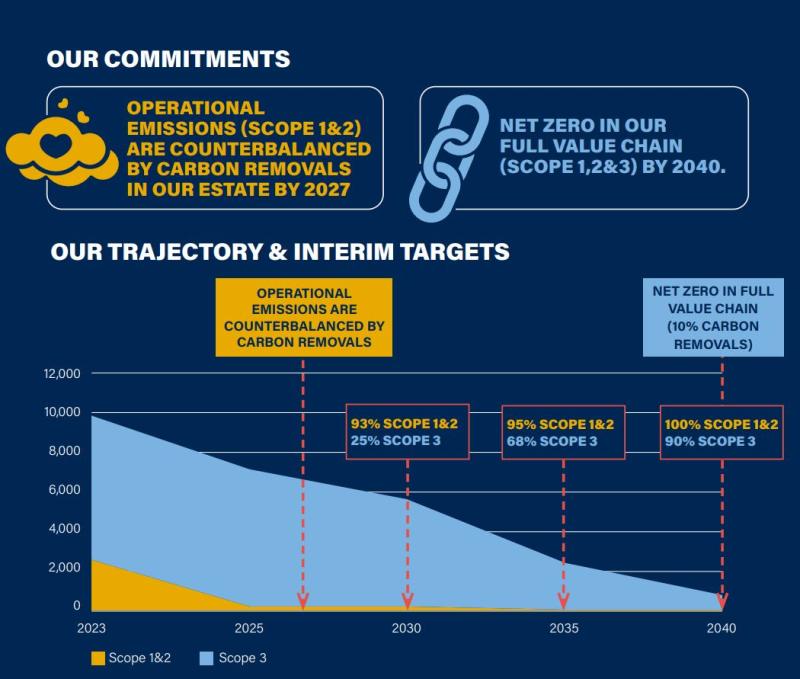
Our reduction actions for Scope 1&2 will leave us with a small but difficult to abate remainder (7%) of emissions by 2030. These emissions are from sources that have no clear technological solutions in the near term. However, we will continue to invest in trialling technology to reduce these emissions. We will also counterbalance these emissions through the management of our land holdings to promote carbon removal. While this cannot offset our operational emissions, we will achieve carbon neutrality of our Scope 1&2 emissions in 2027 – which is a major milestone on our path to true net zero.
Scope 3 emissions are more difficult to reduce as we have less direct ability to act. We have set our trajectory in line with the science based target initiative approach to achieving 1.5 degr
ees. As our major source of Scope 3 emissions is purchased goods and services, we will focus early on engaging with our suppliers on their own decarbonisation journeys.
Actions to Net Zero
Operational Carbon (Scope 1&2)
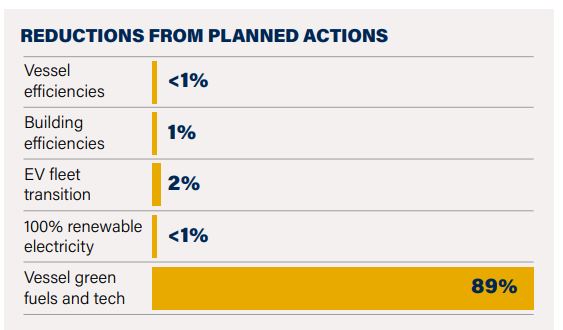
Most of our emissions in Scope 1&2 are from fuel used in our vessel fleet. After a successful transition to HVO in the PLA’s fleet, we have drastically reduced emissions from this source (by 83% compared to 2014). To meet our targets, we will continue the transition to HVO for the remainder of our group fleet, continue our vessel efficiencies programme, complete the roll out of the building efficiencies programme, continue our EV fleet transition, and procure 100% renewable energy for the rest of our estate.
CASE STUDY – PORT CONTROL CENTRE RETROFIT In 2023 we started a project to upgrade our Port Control Centre. Starting from first principles we used sustainability as part of our design criteria – opting for a retrofit rather than rebuild to reduce emissions. The project will reduce our energy consumption for this building by 80% through integrating a wide variety of sustainability practices such as:
- Improved insulation with a high-performance insulated cladding,
- New windows with optimized glazing to limit unwanted excess summer solar gain but maintain a level of useful winter solar gain, • High-efficiency LED lights with efficient lighting controls,
- Provision of efficient air source heat pumps for heating and cooling,
- Heat recovery on mechanical ventilation and air handling plant,
- Photovoltaic panels
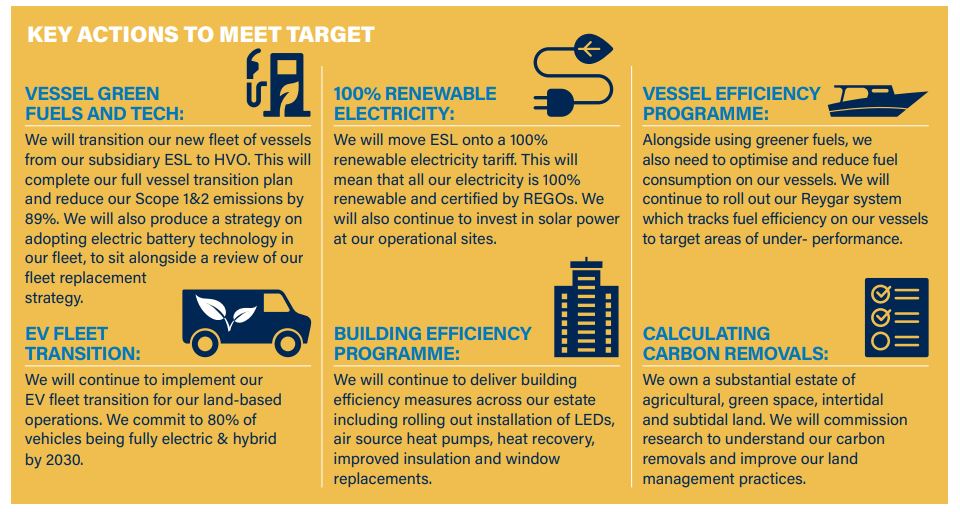
Actions to Net Zero
Value Chain Carbon (Scope 3)
We are committed to reducing our Scope 3 emissions by 25% by 2030 (in line with a 1.5 trajectory). Our largest source of Scope 3 emissions is in our supply chain. Meeting our near-term target will require us to work with our supply chain on emissions reductions.
We have started trialling whole life carbon (WLC) assessments in our capital projects. For example, our Marine Centre Transformation Programme WLC assessment resulted in a refurbishment of the building instead of full rebuild.
We also recognise that we are not reporting the emissions from our downstream leased assets to a high enough level of accuracy. We will focus on engaging with tenants to understand and reduce their emissions.
Supplier Engagement Targets
62% of our Scope 3 emissions come from our purchased goods and services, and capital projects. As a result, alongside absolute carbon reductions, we have also developed supplier engagement targets. This demonstrates our commitment to work with our supply chain to reduce emissions. By 2030 we will engage with 50 Tier 1 suppliers representing 80% of our supply chain emissions.
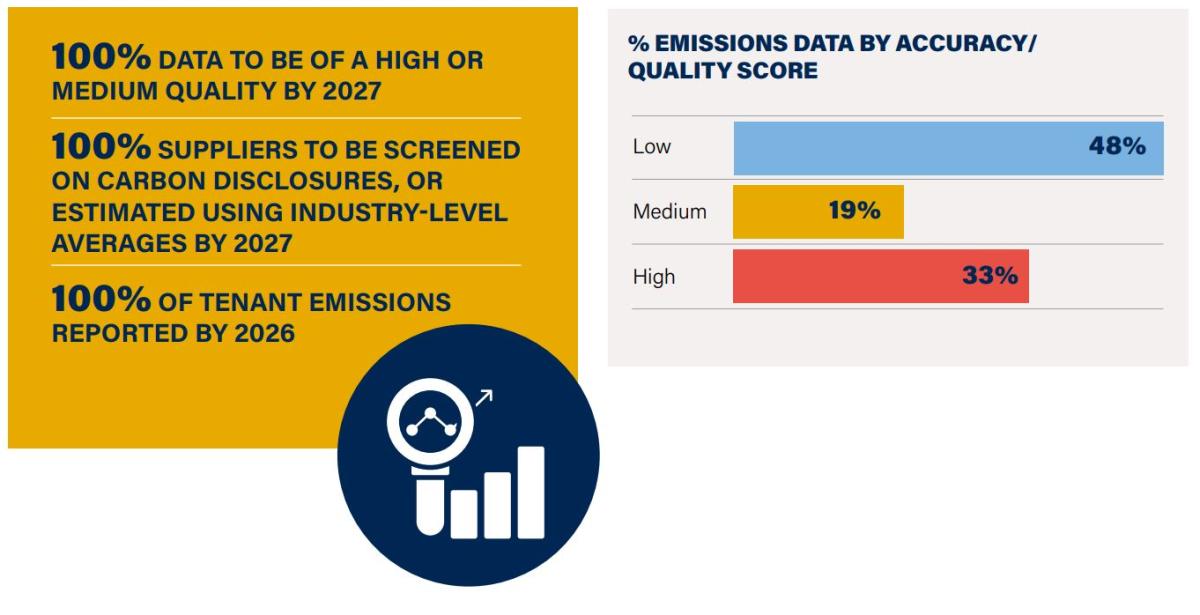
Improving Data
We know that our performance is only as good as the data that underpins it.
That is why we are committed to improving our emissions data across all our scopes.
As part of our review, we assessed all our data sources against criteria of accuracy and quality. For example, all our data sources for our Scope 1&2 emissions have been rated as high or medium accuracy and quality – giving us a high level of confidence in our Scope 1&2 footprint.
We have a lower level of confidence over our Scope 3 data.
This is consistent with the wider industry trends as Scope 3 is third party data or estimates based on proxies. Our key areas of focus for data improvements are: