Live Tides
NOTICES TO MARINERS
Charts & Surveys

Incident reporting
Life-threatening emergencies on the river:
Call 999 and ask for the Coastguard
For near miss, safety observations and incident reporting click below
Emissions and performance of alternative diesel fuels on PLA Harbour Service Vessel - Kew
1. Executive Summary
The report presents results of the trial and exhaust gas sampling and measurement from PLA Harbour Service Vessel, Kew, operating on Ultra-Low-Sulphur Diesel (ULSD), Gas-To-Liquid (GTL) and Hydrotreated Vegetable Oil (HVO) fuel.
Exhaust gas monitoring demonstrated a reduction in nitrogen oxides and particulate matter emissions when operating with GTL and HVO relative to ULSD at all engine speeds. A reduction of carbon dioxide emissions during operation with GTL, however, that might be resulted from a lower fuel flow rates and reduced engine work out for a given sampling speed.
The trials of GTL and HVO indicated no significant increase in fuel consumption rate relative to ULSD and caused no damage to the engine. A reduction in soot deposition on the piston crowns, valves and injector nozzles was also observed. No additional servicing was required during the trials of GTL and HVO relative to ULSD.
The use of HVO can reduce the greenhouse gas emissions associated with an organisation’s activities as the carbon dioxide emitted during combustion is deemed to have been offset by the absorption of carbon dioxide during growth of the biomass that forms the biofuel.
| Table 1 Abbreviations | |
| Air Quality Strategy | AQS |
| Carbon Dioxide | CO2 |
| Carbon Dioxide Equivalent | CO2e |
| Carbon Monoxide | CO |
| Gas-To-Liquid | GTL |
| Greenhouse Gases | GHGs |
| Horsepower | hp |
| Hydrotreated Vegetable Oil | HVO |
| Particulate Matter | PM |
| Polycyclic Aromatic Hydrocarbons | PAH |
| Nautical mile | Nm |
| Nitrogen Oxides | NOx |
| Revolutions per minute | rmp |
| Sulphur Dioxide | SO2 |
| Total Hydrocarbon | THC |
| Ultra-Low-Sulphur Diesel | ULSD |
List of Figures
Figure 1 Harbour Service vessel, Kew.
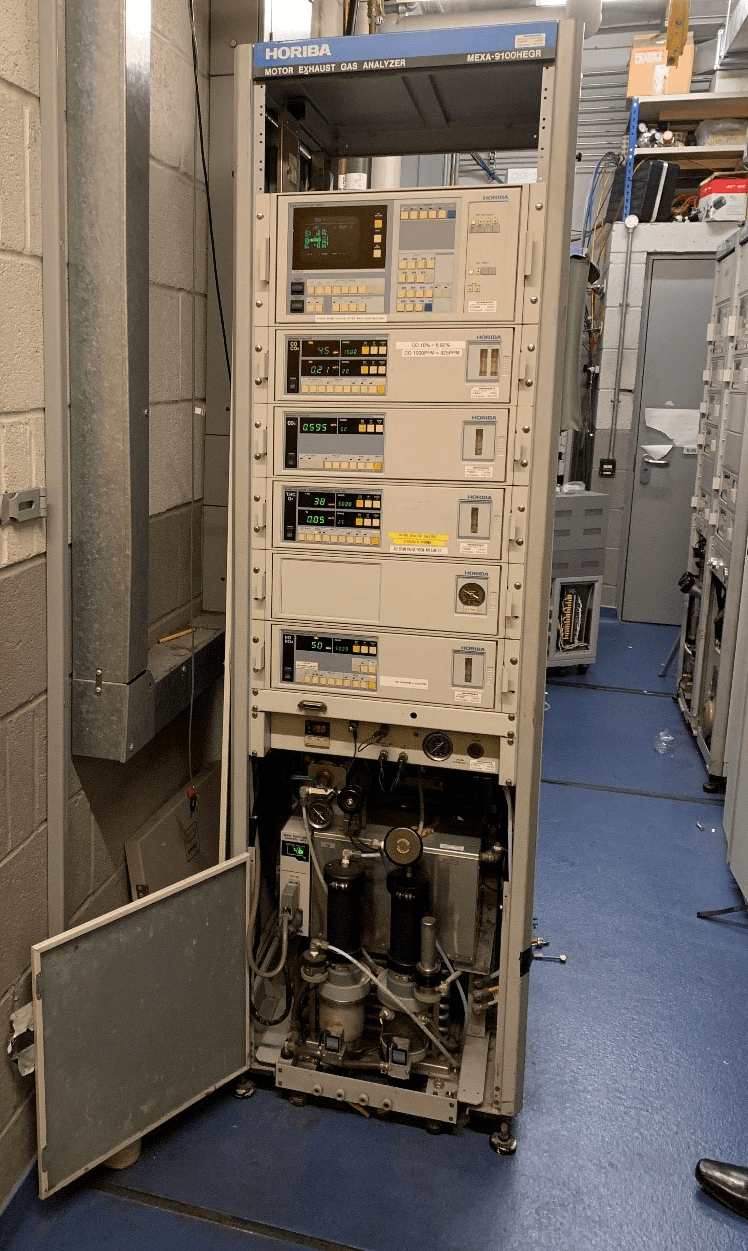
Figure 2 Horiba 9100 Mexa analyser at the laboratory of University College London.
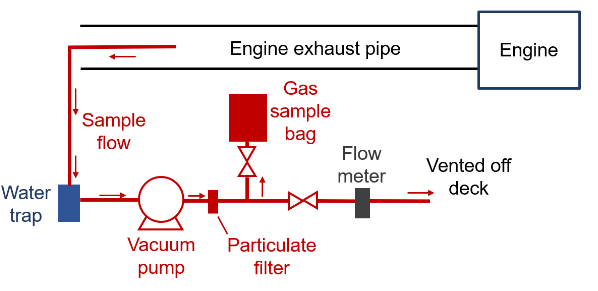
Figure 3 Schematic of the sampling assembly. Image credit: Department of Mechanical Engineering, University College London.
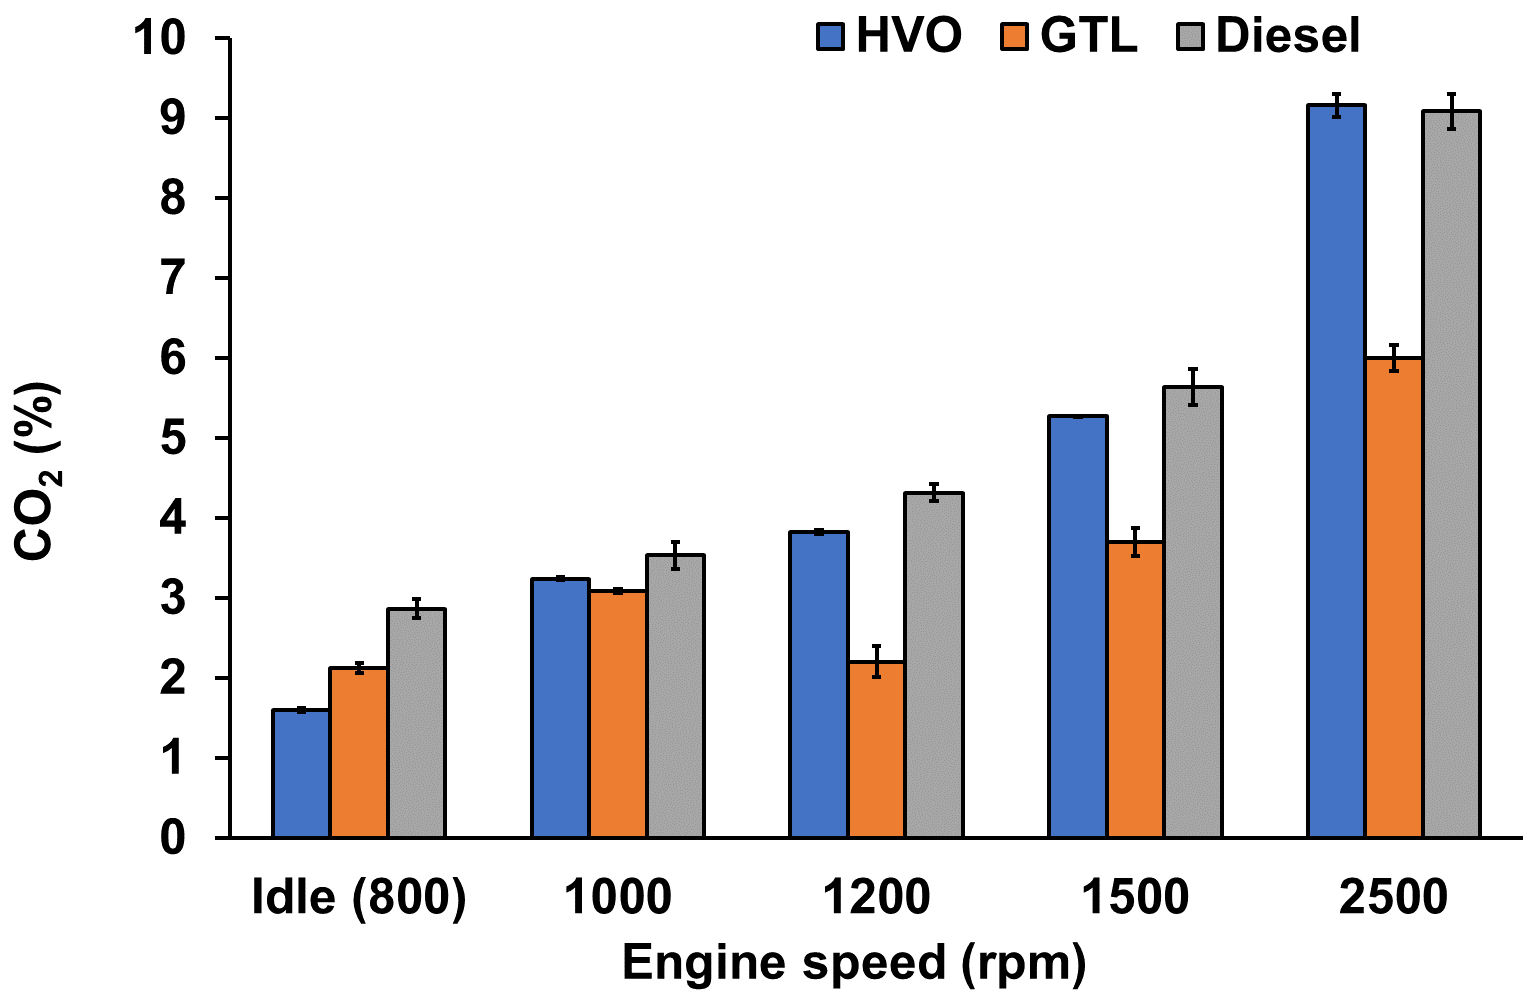
Figure 4 Exhaust gas concentrations of CO2 (% vol/vol) from the starboard engine at 5 speed conditions operated on Diesel, GTL, and HVO.
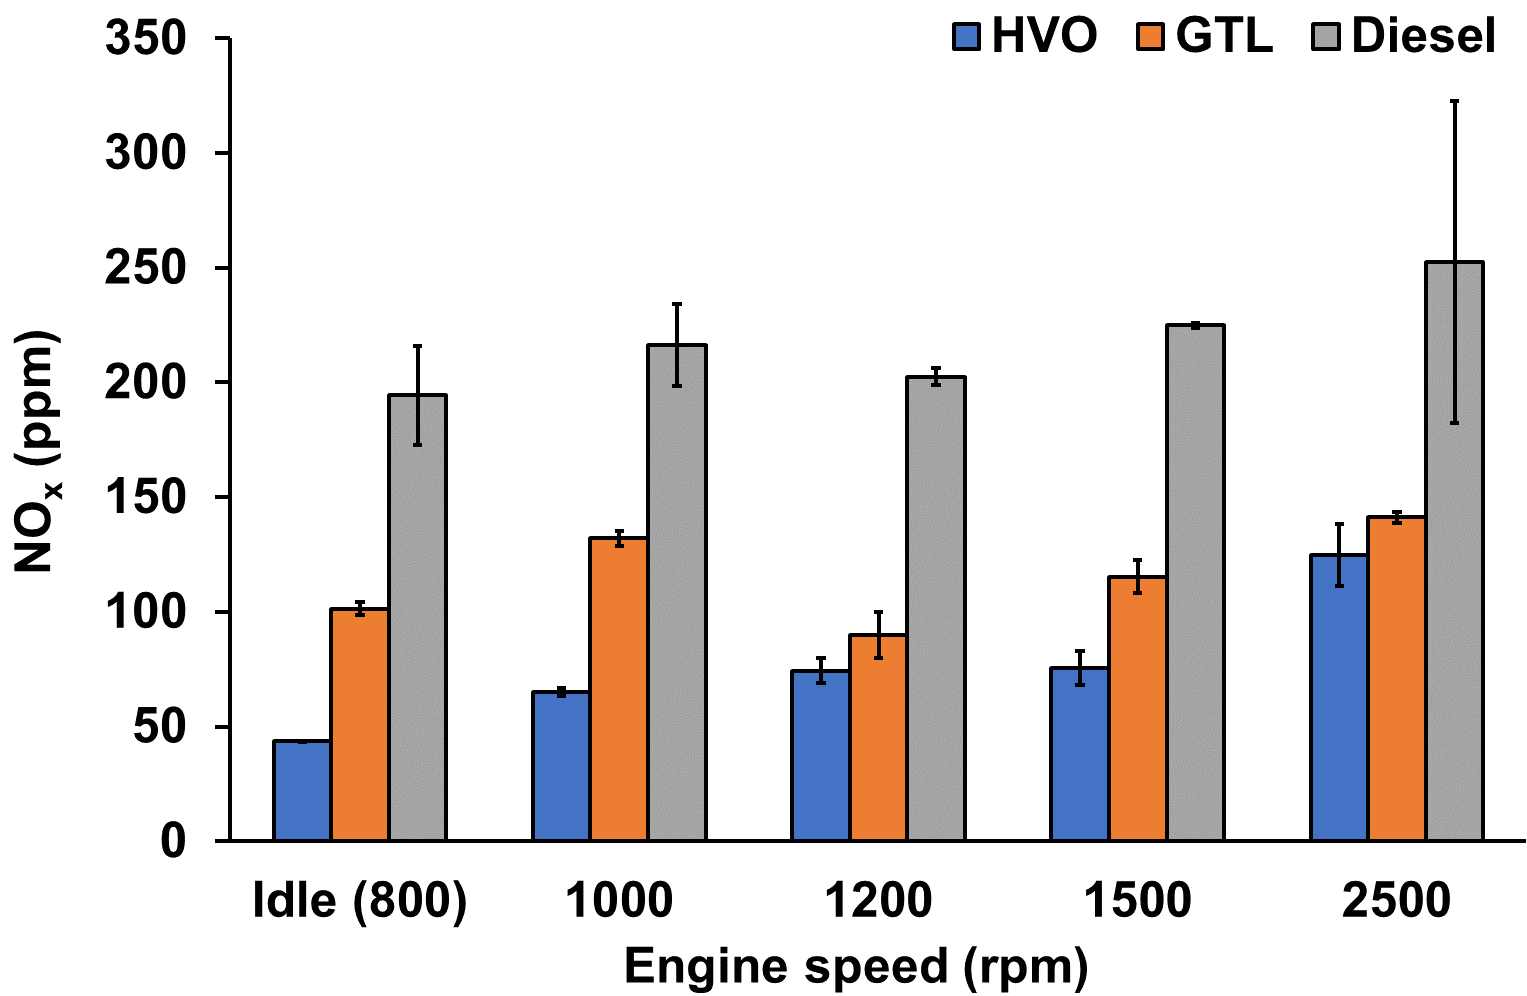
Figure 5 Exhaust gas concentrations of NOx (ppm) from the starboard engine at 5 speed conditions operated on Diesel, GTL, and HVO.
Figure 6 Exhaust gas concentrations of PM (mg/L) from the starboard engine at 5 speed conditions operated on Diesel, GTL, and HVO.
Figure 7 Exhaust gas concentrations of THC (ppm) from the starboard engine at 5 speed conditions operated on Diesel, GTL, and HVO.
Figure 8 Exhaust gas concentrations of CO (%) from the starboard engine at 5 speed conditions operated on Diesel, GTL, and HVO.
List of Tables
Table 1 Abbreviations
Table 2 Typical Annual Operation Profile
Table 3 Selected fuel properties from fuel data sheets.
Table 4 The average fuel consumption rate, L/NM, with ULSD, GTL and HVO fuels by Kew.
Table 5 Estimated annual emissions of NOx, PM, and THC.
Table 6 Estimated annual emissions of scope 1 CO2e and “outside of scope” CO2 from the PLA’s Harbour Service vessel.
2. Background

Air pollutants, such as nitrogen oxides (NOx) and particulate matter (PM), are emitted from the combustion of fuels and can have short- and long-term impacts on people’s health and ecology. The updated Air Quality Strategy for the Tidal Thames (AQS) in 2020, which reflect the changes in policies, regulations, such as the Clean Air Strategy, and Clean Maritime Plan, and progress, has set out reduction targets relative to the 2016 baseline for NOx and PM are 20% by 2026, 40% by 2031, 50% by 2041, and 77 & 78% by 2051 at a port level.
Adopting alternative diesel fuels, defined here as fuels that are functionally equivalent to diesel fuel and are able to substitute diesel fuel without infrastructure or engine changes, with reduced air emissions is one way to achieve short-term air quality targets and as a transitional solution to reduce the carbon footprint before zero emission technologies reach maturity.
3. Introduction
Alternative diesel fuels have been widely used at a commercial scale in road transport, but there is still relatively limited operational experience with their use in vessel engines to allow the PLA to make an informed decision on which alternative fuel to switch to. Therefore, the PLA had undertaken trials on Gas-To-Liquid (GTL) and Hydrotreated Vegetable Oil (HVO) on one of the Harbour Service vessels, Kew (see Section 3.1 for details), to better understand the environmental benefits relative to Ultra-Low-Sulphur Diesel (ULSD) and to identify if there are any unintended consequences.
To evaluate the air emissions reduction in a maritime setting, the PLA had commissioned University College London to compare the pollutant concentration within the exhaust gas during the operation with neat ULSD, neat GTL, and neat HVO (see Section 3.2-3.5 for the brief description of the fuels). A post-trial engine inspection was also carried out by the PLA’s engineers to ensure there are no unintended consequences to the state of the engines.
A use case that based on the average annual usage of the Kew and the fuel consumption rate of each fuels was also established to appraise the potential air and greenhouse gas emissions saving of the alternative diesel fuels.
3.1 Vessel Specifications & Profile
The PLA’s Harbour Service vessel, Kew, is 13.5 m long, 4.8 m wide with a weight of 11 tonnes and has two Tier II marine diesel engines, John Deere 6068TFM75 6.8 Litre Straight 6 marinesed engines producing 201 hp at 2600 rpm. They are keel cooled and have dry exhausts and each engine has an independent fuel tank. The fuel system for each engine has a Racor 30 micron external fuel filter followed by the engines 30 micron primary fuel filter. This is finally followed by an oil and water separator.
Kew is used in the middle and lower districts of the tidal Thames, between Putney Bridge and the North Sea, to provide regular patrol. The vessel can achieve top speeds of around 20 knots. The typical annual operational profile is as listed in Table 2.
| Table 2 Typical Annual Operation Profile | |
| Annual Distance Travelled | 2,1110 Nm |
| Average Vessel Speed | 10 knots |
3.2 Ultra-Low-Sulphur Diesel (ULSD)
Sulphur is a naturally occurring component of crude oil, including diesel, and sulphur dioxide (SO2) or sulphur particulate matter are emitted when the fuels are burned. The Ultra-Low-Sulphur Diesel (ULSD) is a diesel fuel that has been refined so that its sulphur content is 15 part per million (ppm, equivalent to mg/kg) or less.1 The European Fuel Quality Directive (2009/30/EC) stated as of 1st January 2011, all gas oil for use in all non-road mobile machinery, including inland waterway vessels, must contain no more than 10 ppm of sulphur.2 To be compliant with the legislation, Kew had been running on ULSD before the start of the trials of alternative diesel fuel.
The lower amount of sulphur in diesel fuel can reduce the emissions of SO2 and sulphur particulate matter. However, the emissions of other air pollutants, such as NOx and other aromatic particulate matter, cannot be reduced without any other post-combustion abatement interventions, such as selective catalytic reduction (SCR) or diesel particulate filter (DPF).
3.3 Gas-To-Liquid (GTL)
The GTL fuel is a synthetic oil derived from natural gas, a type of fossil energy source, but have distinctly different characteristics than the traditional diesel fuel. The GTL fuel has a paraffinic nature, high cetane number, low amounts of total aromatic and sulphur content compared to traditional diesel fuel (Table 3), which have the potential to reduce the emissions of PM. The higher cetane number also leads towards improved combustion that might result in lower carbon monoxide (CO) and Total Hydrocarbon (THC) emissions.3,4
It is colourless, odourless, non-toxic, and biodegradable that it can be packaged, transported, and stored using the same equipment, materials, and procedures as conventional diesel. It also exhibits the flexibility to use as a direct fuel or in blends with fossil fuel which allows seamless introduction without major engine modifications or a new engine or refuelling infrastructure. Due to the potential of lower emissions compared to traditional diesel fuel, it is regarded as a clean alternative fuel.
3.4 Hydrotreated Vegetable Oil (HVO)
Hydrotreated Vegetable Oils (HVO), a type of biofuel and commonly referred to as renewable diesel, is produced from vegetable and/or animal oils and fats through hydro processing.5 The feedstock for HVO is flexible, allowing the use of a wide range of low quality waste and residue materials, such as food waste and oil removed from wastewater sewers (also known as brown grease), for fuel production. HVO produced from waste is considered to have zero-life cycle greenhouse gas (GHG) emissions up to the process of collection of the materials can typically save 88% of the life cycle GHG emission1 relative to diesel fuel.2 The HVO fuel produced from vegetable oil, such as rapeseed, sunflower, and palm oil, can have a typical life cycle greenhouse gas emission savings between 40%-68% relative to diesel fuel2 due to the capture of carbon dioxide during the growth of the plant. However, the other key additional feedstock needed for HVO production is hydrogen, which today comes mainly from a fossil source.5
The HVO fuel has similar fuel properties as the GTL fuel (Table 3) that it also has the potential of reducing the emissions of PM, CO, and THC. Some HVO fuels on the market contain an additive system, which aids to reduce the emissions of air pollutants chemically and cleaner combustion.6 Among other components, the additive package includes a detergent that could potentially cleans the fuel system, valves and injectors.
The HVO fuel also exhibits the flexibility to use as a drop-in replacement for traditional diesel fuel that it can be used without needing engine and infrastructure modifications. The unsaturation and contaminants were removed during production that it is has better storage stability5 and relatively long shelf life.7
3.5 Blend with Diesel Fuel
The alternative diesel fuel trials on Kew did not include blended fuels, however, it is possible to blend in any desired ratio of GTL or HVO into diesel fuels without compromising fuel quality and engine modification.8 Fuel Quality Directive 2009/30/EC (recital 33) states that limit for the content of biodiesel is not required for diesel-like hydrocarbon biofuels and HVO.
Laboratory and land-based studies shown the GTL-diesel or GTL-biodiesel-diesel mixture resulted in a decrease in CO, PM, THC, and SO2 emissions compared to that for diesel.9,10,11 The results for NOx emissions from the blended fuel were inconsistent. In general, except for NOx, the reduction in emissions increases with the increase in percentage of GTL or biodiesel, however, it is uncertain that the improvement is correlated linearly with the content of the alternative fuel or not.
For the HVO-diesel blend, some studies shown the HVO blend resulted in CO, PM, and THC reduction compared to that for diesel,12,13 however, some studies shown the HVO blends did not lead to any reduction in regulated emissions.14
| Table 3 Selected fuel properties from fuel data sheets | ||||
| ULSD | GTL | HVO | 70% Diesel* + 30% HVO15 | |
| Cetane number | 53 | 70 | 70 | 65 |
| Density at 15 ˚C, kg/m3 | 831.1 | 765-800 | 770 | 820 |
| Viscosity at 40 ˚C, mm2/s | 2.721 | 2-4.5 | 2-4 | 3.4 |
| Total aromatics content, % (m/m) | 3.1** | 1.1 | 1.0 | 1 ** |
| Sulphur content, mg/kg | 6.8 | 5 | 5 | |
| Distillation 95 % recovered at X ˚C, ˚C | 353.8*** | 360 | 320 | 355 |
| Distillation Y % recovered at 250 ˚C, % | 36 | < 65 | < 65 | N/A |
| Distillation Y % recovered at 350 ˚C, % | 95.2 | 85 | 85 | N/A |
* Diesel = European EN 590:2004 diesel fuel ** Polycyclic Aromatic Hydrocarbons (PAH) only *** 96% | ||||
4. Methodology
The alternative fuel trials and exhaust gas monitoring were undertaken by one of the PLA’s Harbour Service vessels, Kew.
4.1 Exhaust Monitoring
The exhaust gas monitoring methodology, samples collection, and analysis were carried by the Department of Mechanical Engineering, University College London.
The engine exhaust emissions samples were collected from Kew that operating on ULSD, GTL, and HVO during a dedicated sampling cruise that embarked and disembarked from Royal Terrance Pier, Gravesend. The starboard engine was sampled from while operating initially on ULSD and following two periods of fuel switchover to GTL then HVO for serval months between each fuel type. No changes in the engine calibrations were made with the switch of fuels. The starboard engine was sampled at an engine idle condition at 800 rpm, and while providing vessel thrust at 1000 rpm, 1200 rpm, 1500 rpm and 2500 rpm.
The collected exhaust samples were subsequently taken to the university’s laboratory for quantitative analysis. The concentration of air pollutants and greenhouse gases, such as NOx, CO, CO2, and THC, within the exhaust gas was analysed by a Horiba 9100 Mexa analyser (Figure 2), and the amount of PM was determined gravimetrically following desiccation. Noting that the CO2 measured within the exhaust are emitted through the combustion of fuel.
The schematic of the sampling assembly is as shown in Figure 3, where a vacuum pump was used to extract gases from the main engine exhaust via a stainless-steel pipe to fill the 10 L Tedlar sample bags and force flow through the 1.0 micrometre pore size filters for collection of the particulates.
4.2 Engine Performance
The tested engine was lifted out of the vessel and returned to the PLA’s engineering workshop for internal examination after both trials were completed. The engine head was removed so that the cylinder bores, piston crowns, inlet and exhaust valves and injector nozzles could be inspected.
The reported average fuel consumption rate for each fuel type was the average of 29-31 days fuel consumption and mileage recorded by Reygar, Marine Performance Monitoring System.
4.3 Use Case – Annual Air & Greenhouse Gas Emissions
The annual air and greenhouse gas emissions saving were estimated using the average annual operational profile of Kew, the average fuel consumption rate, and emission/conversion factors.
The air pollutant emissions of ULSD are estimated with emission factors from the National Emission Inventory for Motorboat. The emission factors, contrasting the exhaust emissions, are used to quantify the amount of emissions from fuel consumed in an activity, and that is the annual distance travel by Kew in this use case. As there are no air pollutant emission factors for Motorboat that operations with GTL or HVO are available, the emissions from GTL and HVO are estimated based on the observed percentage reduction relative to ULSD in the exhaust gas samples at an engine speed of 1500 rpm.
The estimations of greenhouse gas emissions are based on the annual fuel consumption and the relevant emission factor from the UK government conversion factors,16 which are updated annually. The values shown in this report are based on the 2020 values. The UK government conversion factor spreadsheet does not contain a value for GTL, and therefore, the calculation for GTL is not included.
Fuel consumed in an activity by an organisation is classified as a Scope 1 greenhouse gas emission2 and is reported as the equivalent greenhouse gases (CO2e) expressed in terms of the global warming potential of CO2. For biofuels the conversion factor is significantly lower than for fossil fuels as the carbon dioxide element of the total greenhouse gases is zero to account for the CO2 absorbed by bioenergy sources during growth. This is the factor reported in an organisation’s carbon footprint. In addition to this, to be transparent about all potential sources of CO2 from its activities, the organisation must report “outside of scope” values which account for the impact of CO2 released during combustion.
5. Exhaust Emissions Results
5.1 Exhaust Concentration of CO2
The levels of CO2 in the exhaust gas samples, representing the CO2 emitted through combustion, during operation with GTL are consistently appreciably lower than that with ULSD, and HVO at engine speeds above 800 rpm. The emissions of CO2 from the pipeline are positively correlated with the amount of fuel burnt, and therefore, the results suggest the fuel flow rates were lower and thus engine load produced during the operation with GTL in compare to with ULSD or HVO despite the equivalent engine speed.
The comparable CO2 emissions during operation with HVO and ULSD at all engine speed suggest similar levels of work produced. The range of CO2 emissions reduction from the combustion of HVO relative to ULSD found in this study also in agreement with the CO2 conversion factors used by the UK government,16 with biofuel conversion factors including an “outside of scopes” CO2 relating to the CO2 emitted during combustion that is deemed to be offset by the growth of the biofuel feedstock. The CO2 conversion factors at the point of combustion is 2.74 kg of CO2 /L for diesel and 2.36 kg of CO2 /L for biofuel.16
5.2 Exhaust Concentration of NOx
In general, the levels of NOx emitted increase with increasing engine speed, especially apparent during operation with ULSD and HVO. A lower NOx concentration during combustion of GTL and HVO relative to ULSD at all engine speeds were observed. The emission of NOx increases rapidly with increasing in-cylinder temperature. A higher engine load is likely to have increased in-cylinder temperature, yet, the total level of NOx produced will have been tempered by the shorter duration at these higher temperatures per combustion cycle with the increase in engine speeds.
In the case of the GTL fuel, this is likely primarily attributable to the lower levels of engine work produced during operation with GTL, as mentioned in Section 5.1. The lower level of fuel burnt resulting in lower in-cylinder temperatures, which reduced the production of NOx. Other experimental studies9 have found a decrease in NOx emissions with GTL compared to those from diesel fuel running, attributable to the higher cetane number of GTL fuel and subsequently a shorter ignition delay. However, the magnitude of the reduction depends on engine load and fuel injection conditions.
For HVO, the emissions of NOx were generally found to be reduced relative to diesel by other combustion studies under laboratory and vehicle testing conditions.17 Nevertheless, the magnitude of reduction is significantly sensitivity to fuel injection timing and other engine operating conditions.
5.3 Exhaust Concentration of PM
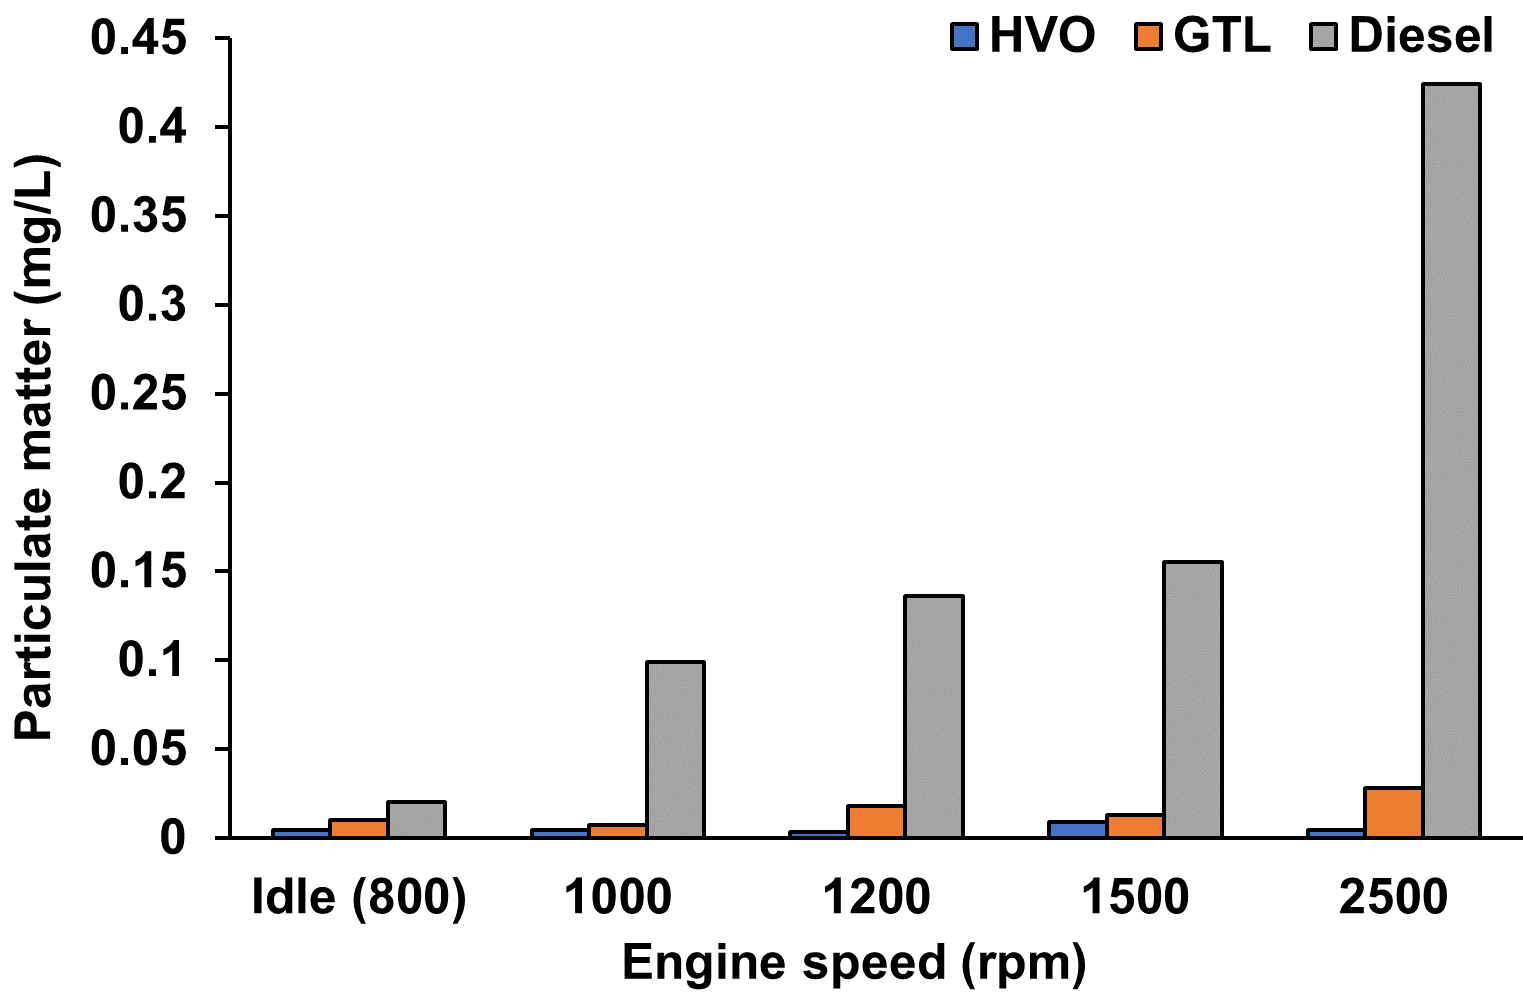
The emissions of PM were significantly lower at all engine speeds during operation with GTL and HVO relative to ULSD. The rate of particulate formation during combustion can be increased by the presence of aromatic molecules within the fuel, as these are the precursors to the formation of initial soot particles. The total aromatics content was not stated for the ULSD; however, the level of PAH is higher than the total aromatics content of the GTL and HVO fuels.
The formation and emission of particulates are also sensitive to the fuel air ratio during combustion, with leaner mixtures reducing soot formation and increasing rates of oxidation. In the case of GTL, the significantly lower PM emissions may in part be attributable to the suggested lower fuel flow at a given engine speed. For HVO, there is no apparent suggestion of a lower engine load relative to ULSD and the reduction likely attributable to the fuel chemical properties.
5.4 Exhaust Concentration of THC
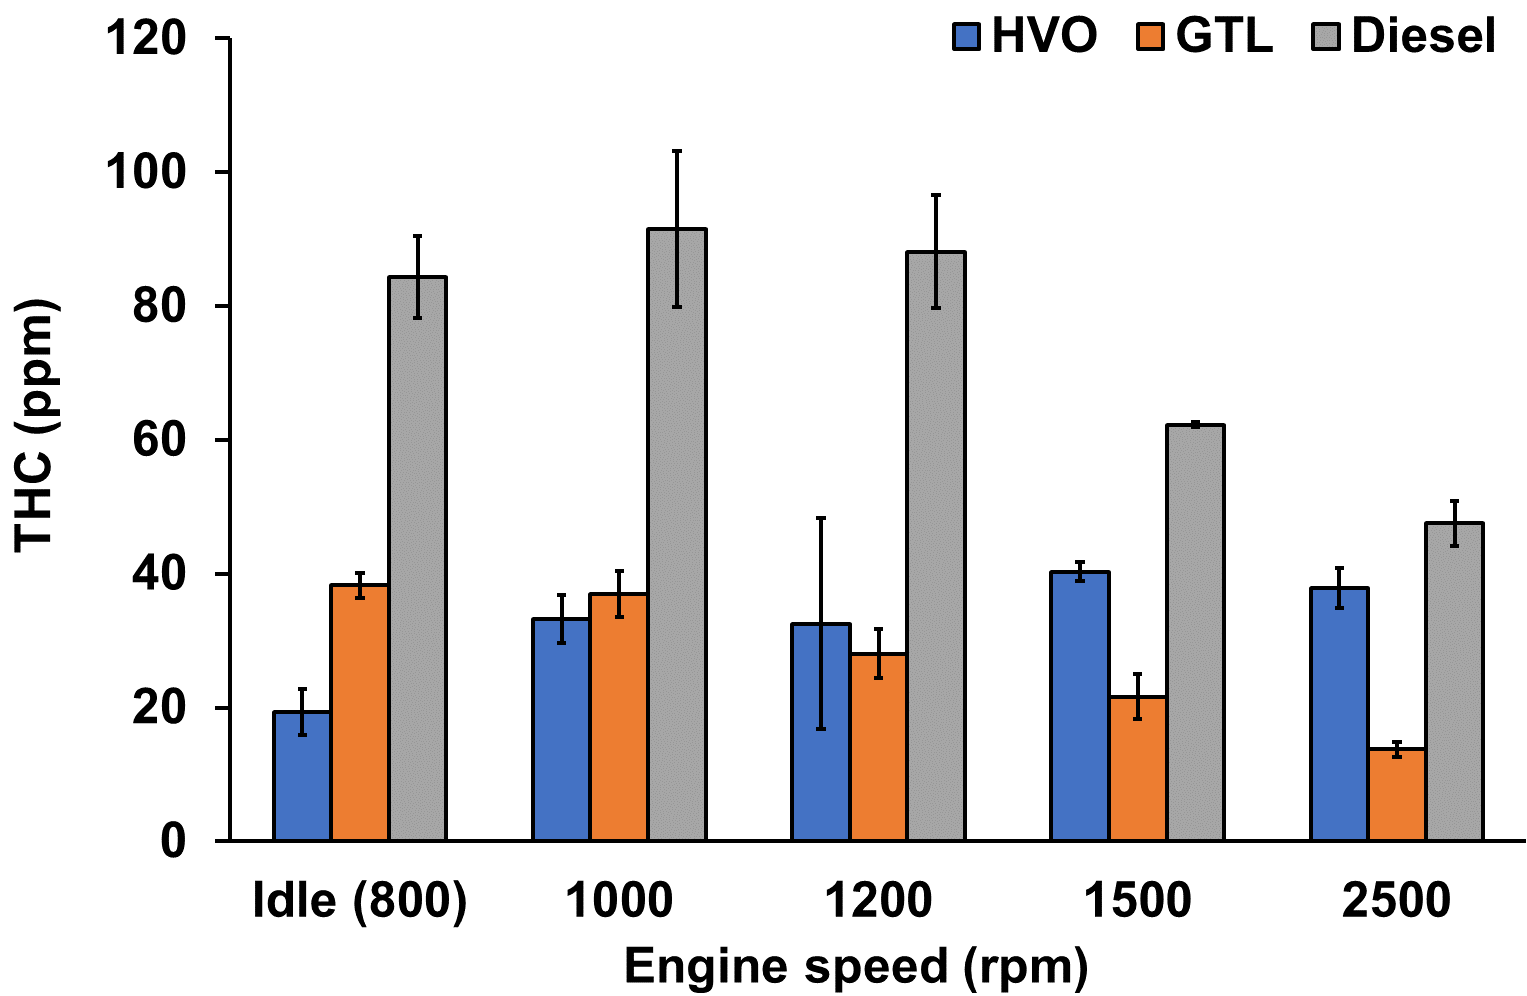
The emissions of THC arise due to incomplete fuel combustion, arising from either insufficient temperatures or levels of oxygen. The increasing engines speeds can be expected to reduce the occurrence of both, with higher levels of energy release and reduced time available for fuel over-dilution.
In general, the emissions of THC decrease with increasing engine speed when operation with ULSD or GTL, and lower THC emissions at a given speed in the case of operation with GTL or HVO relative to that with ULSD. The significantly higher cetane number of the GTL and HVO fuel relative to ULSD would likely have reduced the duration of fuel ignition delay following the start of injection and decreased the time available for fuel over-dilution prior to the start of combination that reduces the production of THC relative to ULSD. Notwithstanding the cetane number is the same for HVO and GTL, the influence of engine speed in THC emissions in operation with HVO were not clear.
5.5 Exhaust Concentration of CO
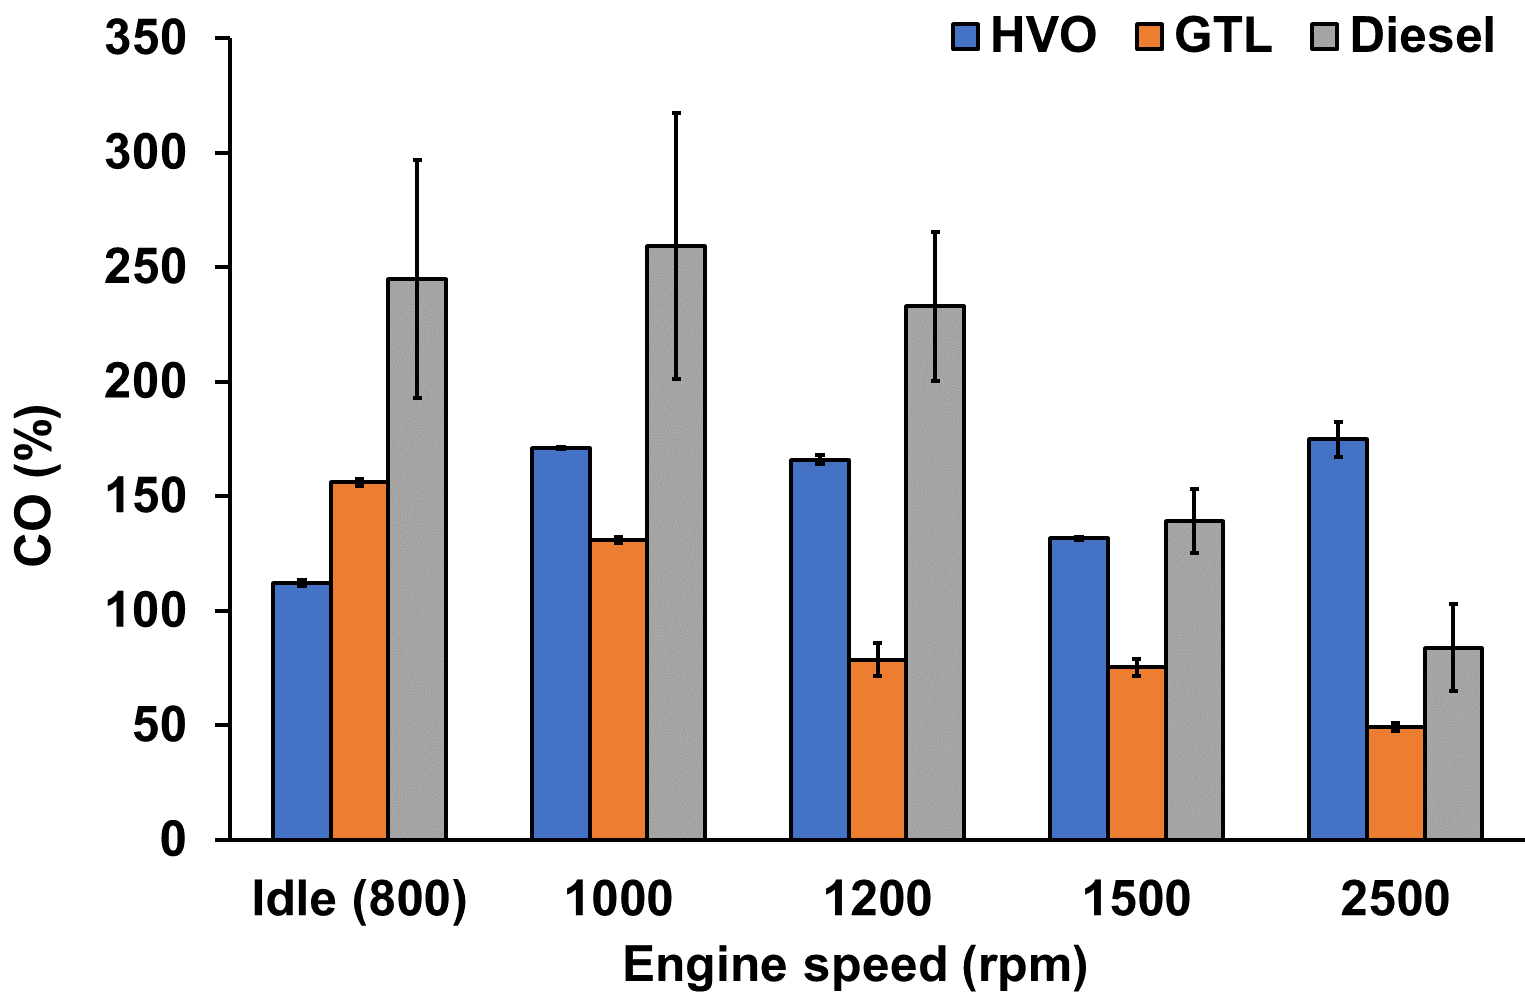
Similar to the formation of THC, emissions of carbon monoxide (CO) arise due to incomplete combustion of fuel carbon, and so might be expected to reduce with increase engine speeds.
The levels of CO emitted show a general decrease with increasing engine speed when operating with ULSD or GTL fuel. The lower levels of CO emitted in the case of operation with GTL relative to ULSD and HVO at all engine speeds greater than 800 rpm is consistent with the suggestion in Section 5.1 that the fuel flow rates, and engine loads were lower during operation with GTL.
In contrast to ULSD and GTL, the highest levels of exhaust CO during operation with HVO were found at the highest engine speed of 2500 rpm. The higher levels of CO observed with HVO are in agreement with the lower emissions of NOx as shown in Section 5.2, which both indicate the lower in-cylinder temperatures in the case of HVO combustion.
5.6 Uncertainties in the Exhaust Monitoring
The exhaust samples were collected on dedicated sampling cruise with the same route but on different day and time. The effects of tide and weather conditions were not considered for the exhaust sampling analysis, which might affect the engine load and fuel consumption, and hence, the emissions.
6. Engine Performance Results
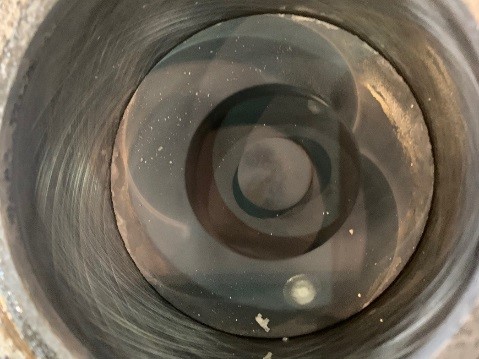
During the trial of GTL and HVO, there were no physical or visible issues caused during operation. This included no blockages and no signs of fuel breakdown. The post-trials inspection, after the trial of both alternative diesel fuels, identified the following:
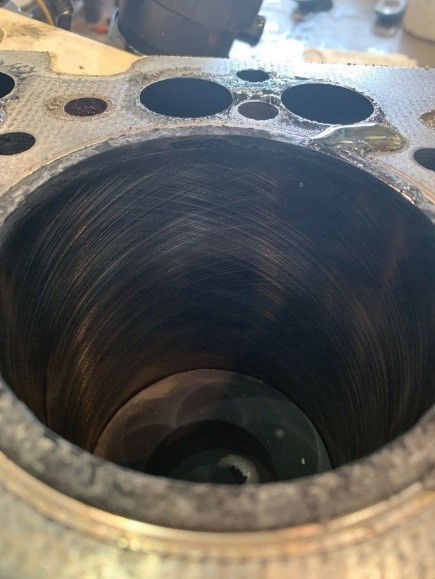 | 1. The presence of intact cross hatching on the cylinder walls, indicating no significant wear and no signs of cylinder glazing, which would impact on lubrication leading the cylinder or piston ring wear. |
 | 2. The piston crowns were found to be fully intact with a light coating of soot that was easily wiped off, which is an improvement on the harder to remove soot particles build up that would normally be found when running ULSD. 3. Neither the fuel makes up or the injectors ability to handle it have resulted in any damage to the piston crowns, suggesting a spray pattern comparable to burning ULSD is still being formed. |
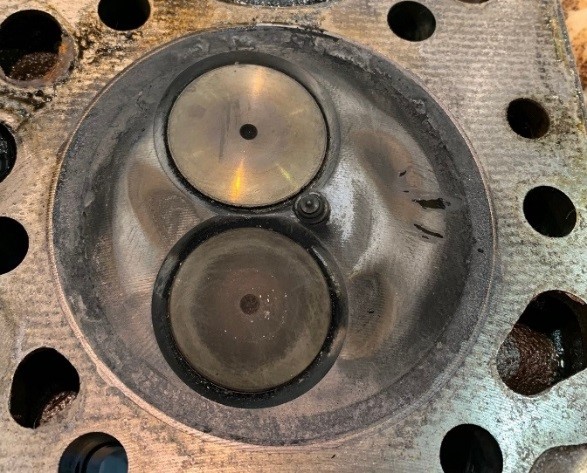 | 4. There are no signs of damage due to early or late combustion which is positive as the increase in cetane value should cause slightly premature combustion. The timing of the engine has not been changed to accommodate alternative fuels. 5. There is a light build-up of soot particles on the valves and injector nozzles and this was easily wiped off. This is an improvement on the harder to remove soot build up that would normally be found when running ULSD. |
The average fuel consumption rate, which averaged from between 29 to 31 days of fuel consumption, with ULSD, GTL, and HVO fuels are shown in Table 4. The trials have not demonstrated a significant difference in the fuel consumption rate between fuels.
| Table 4 The average fuel consumption rate, L/NM, with ULSD, GTL and HVO fuels by Kew | |||
| Fuel | ULSD | GTL | HVO |
| Consumption rate, L/ Nm | 2.94 | 3.17 | 2.99 |
7. Use Case Result
7.1 Annual Air Pollutant Emissions
The estimated annual emissions of NOx, PM, and THC is shown in Table 5. The emissions of PM are significantly lower with the use of alternative fuels. The emissions of NOx are almost halved for GTL and almost a third for HVO.
| Table 5 Estimated annual emissions of NOx, PM, and THC | |||
| Annual Emissions \ Fuel Type | ULSD | GTL | HVO |
| NOx, kg | 2432 | 1240 | 827 |
| PM, kg | 236 | 19 | 14 |
| THC, kg | 2845 | 711 | 1850 |
7.2 Annual Greenhouse Gas Emissions
The scope 1 CO2e and the “outside of scope” CO2 emissions are listed in Table 6. The scope 1 CO2e is significantly lower with the use of HVO relative to ULSD due the uptake of CO2 during the growth of the plant or organic waste being used as feedstock. No CO2e or CO2 values were calculated for GTL as there is no conversion factor available. However, as mentioned in the Introduction that the feedstock of GTL is natural gas, a type of fossil fuel.
| Table 6 Estimated annual emissions of scope 1 CO2e and “outside of scope” CO2 from the PLA’s Harbour Service vessel | |||
| Annual Emissions \ Fuel Type | ULSD | GTL | HVO |
Carbon Footprint Scope 1 CO2e, tonne* | 172 (of which 170 is CO2) | N/A | 10 |
| Reported separately “outside of scopes” CO2, tonne | N/A | 149 | |
Summary
Exhaust gas samples were collected from one of the PLA’s Harbour Service vessels, Kew, operating on neat ULSD, neat GTL, and neat HVO under various engine speeds. The concentration of air pollutants and greenhouse gas, including NOx, PM, THC, and CO2, within the exhaust gas samples were then analysed at an independent laboratory.
• CO2 emitted during the combustion of GTL were 12-49% lower compare to ULSD. However, reduced level of CO2 during the operation with GTL are suggestive of lower fuel flow rates and reduced engine work out for a given engine sampling speed. For HVO, the CO2 reduction was 7-44% at engine speed at/lower than 1500 rpm and a 1% increase at the highest tested engine speed at 2500 rpm.
• NOx emissions reduced with the use of GTL and HVO fuels relative to ULSD. HVO recorded 51-78% reduction while GTL recorded 39-56% reduction in NOx. However, evidence suggested that the reduced NOx formation with GTL might be attributed to the reduced rate of fuel delivery, which subsequent resultant lower in-cylinder temperatures for a given engine speed.
• PM emissions reduced significantly with the use of GTL and HVO fuels relative to ULSD. HVO recorded 76-99% reduction while GTL recorded 50-93 % reduction in PM. The reductions are attributable to the paraffinic nature and reduced aromatic content of both fuels.
• CO and THC emissions were both lower with the use of GTL fuels relative to ULSD. However, the emissions of CO and THC were generally higher with the use of HVO relative to GTL, and some conditions ULSD, suggesting a greater degree of incomplete combustion due to fuel over-dilution or insufficient temperatures.
The vessel engine was also lifted out and had a full inspected after the trials by the PLA’s engineers.
• No physical or visible operational issues, including no blockages and no signs of fuel breakdown, were experienced during the trials.
• No additional servicing, which carried for every 400 hours of operation, was required during the trials of GTL and HVO relative to ULSD.
• The post-trials engine inspection identified no significant wear and no signs of cylinder glazing, no signs of damage due to changing of combustion timing related to the higher cetane number, and reduced soot deposition on the piston crowns, valves and injector nozzles.
• The fuel consumption rate with ULSD, GTL, and HVO fuels were found not to be significantly different during the trial.
The greenhouse gas emissions associated with an organisation’s activities based on the average annual usage and UK government conversion factor were estimated
• The scope 1 equivalent greenhouse gases (CO2e) emissions were significantly lower with the use of HVO compare to ULSD as the carbon dioxide emitted during combustion is deemed to have been offset by the absorption of carbon dioxide during growth of the biomass that forms the biofuel.
• No comparison was made against GTL as there is no conversion factor available for GTL.
References
1 European Commission, “Alternative Fuels for Marine and Inland Waterways; An exploratory Study (Report EUR 27770 EN),” European Union, EUR, 2016.
2 European Parliament and of the Council of 23 April 2009, Directive 2009/30/EC, Special edition in Croatian: Chapter 13 Volume 055 P. 187 - 212, Current consolidated version: 10/06/2016.
3 M. Oguma, S. Goto, K. Oyama, K. Sugiyama and i. M. Mor, “The Possibility of Gas to Liquid (GTL) as a Fuel of Direct Injection Diesel Engine.,” SAE Technical Paper 2002-01-1706, 2002.
4 M. Lapuerta, O. Armas, J. Hernández and A. Tsolakis, “Potential for reducing emissions in a diesel engine by fuelling with conventional biodiesel and Fischer–Tropsch diesel.,” fUEL, vol. 89, pp. 3106-13, 2010.
5 European Alternative Fuel Observatory, “Hydrotreated Vegetable Oils (HVO),” European Alternative Fuel Observatory, [Online]. Available: https://eafo.eu/alternative-fuels/advanced-biofuels/hvo. [Accessed 3 2021].
6 New Era, “GreenD+ HVO,” New Era, [Online]. Available: https://newerafuels.co.uk/green-d-hvo/. [Accessed 3 2021].
7 Crown Oil, “HVO Fuel (Hydrotreated Vegetable Oil Fuel),” Crown Oil, [Online]. Available at this link. [Accessed 3 2021].
8 Y. Huang, S. Wang and L. Zhou, “Effects of Fischer-Tropsch diesel fuel on combusion and emissions of direct injection diesel engine,” Frontier of Energy and Power Engineering in China, vol. 2, no. 3, pp. 261-267, 2008.
9 H. Sajjad et al., “Engine combustion, performance and emission characteristics of gas to liquid (GTL) fuels and its blends with diesel and bio-diesel,” Renewable and Sustainable Energy Reviews, 2014.
10 M. Gunfeel, Y. Lee, K. Choi and D. Jeong, “Emission characteristics of diesel, gas to liquid, and biodiesel-blended fuels in a diesel engine for passenger cars,” Fuel, vol. 89, no. 12, pp. 3840-3846, 2010.
11 M. Bassiony, A. Ibrahim and M. El-Kassaby, “An experimental study on the effect of using gas-to-liquid (GTL) fuel on diesel engine performance and emissions,” Alexandria Engineeering Journal, vol. 55, no. 3, pp. 2115-2124, 2016.
12 L. Rantanen, R. Linnaila, P. Aakko and T. Harju, “NExBTL - Biodiesel Fuel of the Second Generation,” SAE Technical Paper 2005-01-3771, 2005.
13 D. Athanasios, N. Ioannis, D. Athanasios, K. Dimitrios, S. Zissis, B. Stella and L. Kalle, “Evaluation of a Hydrotreated Vegetable Oil (HVO) and Effects on Emissions of a Passenger Car Diesel Engine,” Frontiers in Mechanical Engineering , vol. 4, no. 7, pp. 2297-3079, 2018.
14 R. Suarez-Bertoa, M. Kousoulidou, M. Clairotte, B. Giechaskiel, J. Nuottimäki, T. Sarjovaara and L. Lonzaa, “Impact of HVO blends on modern diesel passenger cars emissions during real world operation,” Fuel, vol. 235, pp. 1427 - 1435, 2019.
15 Neste Oil, “Hydrotreated Vegetable Oil (HVO) - premium renewable biofuel for diesel engines,” Neste Oil Proprietary publication, 2014.
16 Department for Business, Energy & Industrial Strategy, “Government conversion factors for company reporting of greenhouse gas emissions,” Gov.uk, 2021 6 2020. [Online]. Available at this link. [Accessed 3 2021].
17 S. Y. No, “Application of hydrotreated vegetable oil from triglyceride based biomass to CI engines - a review,” Fuel, vol. 115, pp. 88-96, 2014.
About the author
Dr Veronica HG Chan, Senior Advisor on Air Quality and Climate Change, BEng, MEng, PhD, Port of London Authority
Veronica joined the Port of London Authority as its senior advisor on air quality and climate change at the beginning of 2020. Prior to this, she had years of experience in Earth science research, mainly working on atmospheric chemistry and climate related studies.
Veronica leads work on the implementation of the PLA’s Air Quality Strategy for the tidal Thames to reduce the harmful emissions to air from marine sources within the tidal River Thames while facilitating the future growth of the port. She is also responsible for the organisation’s adaptation in response to climate change.
Discover


